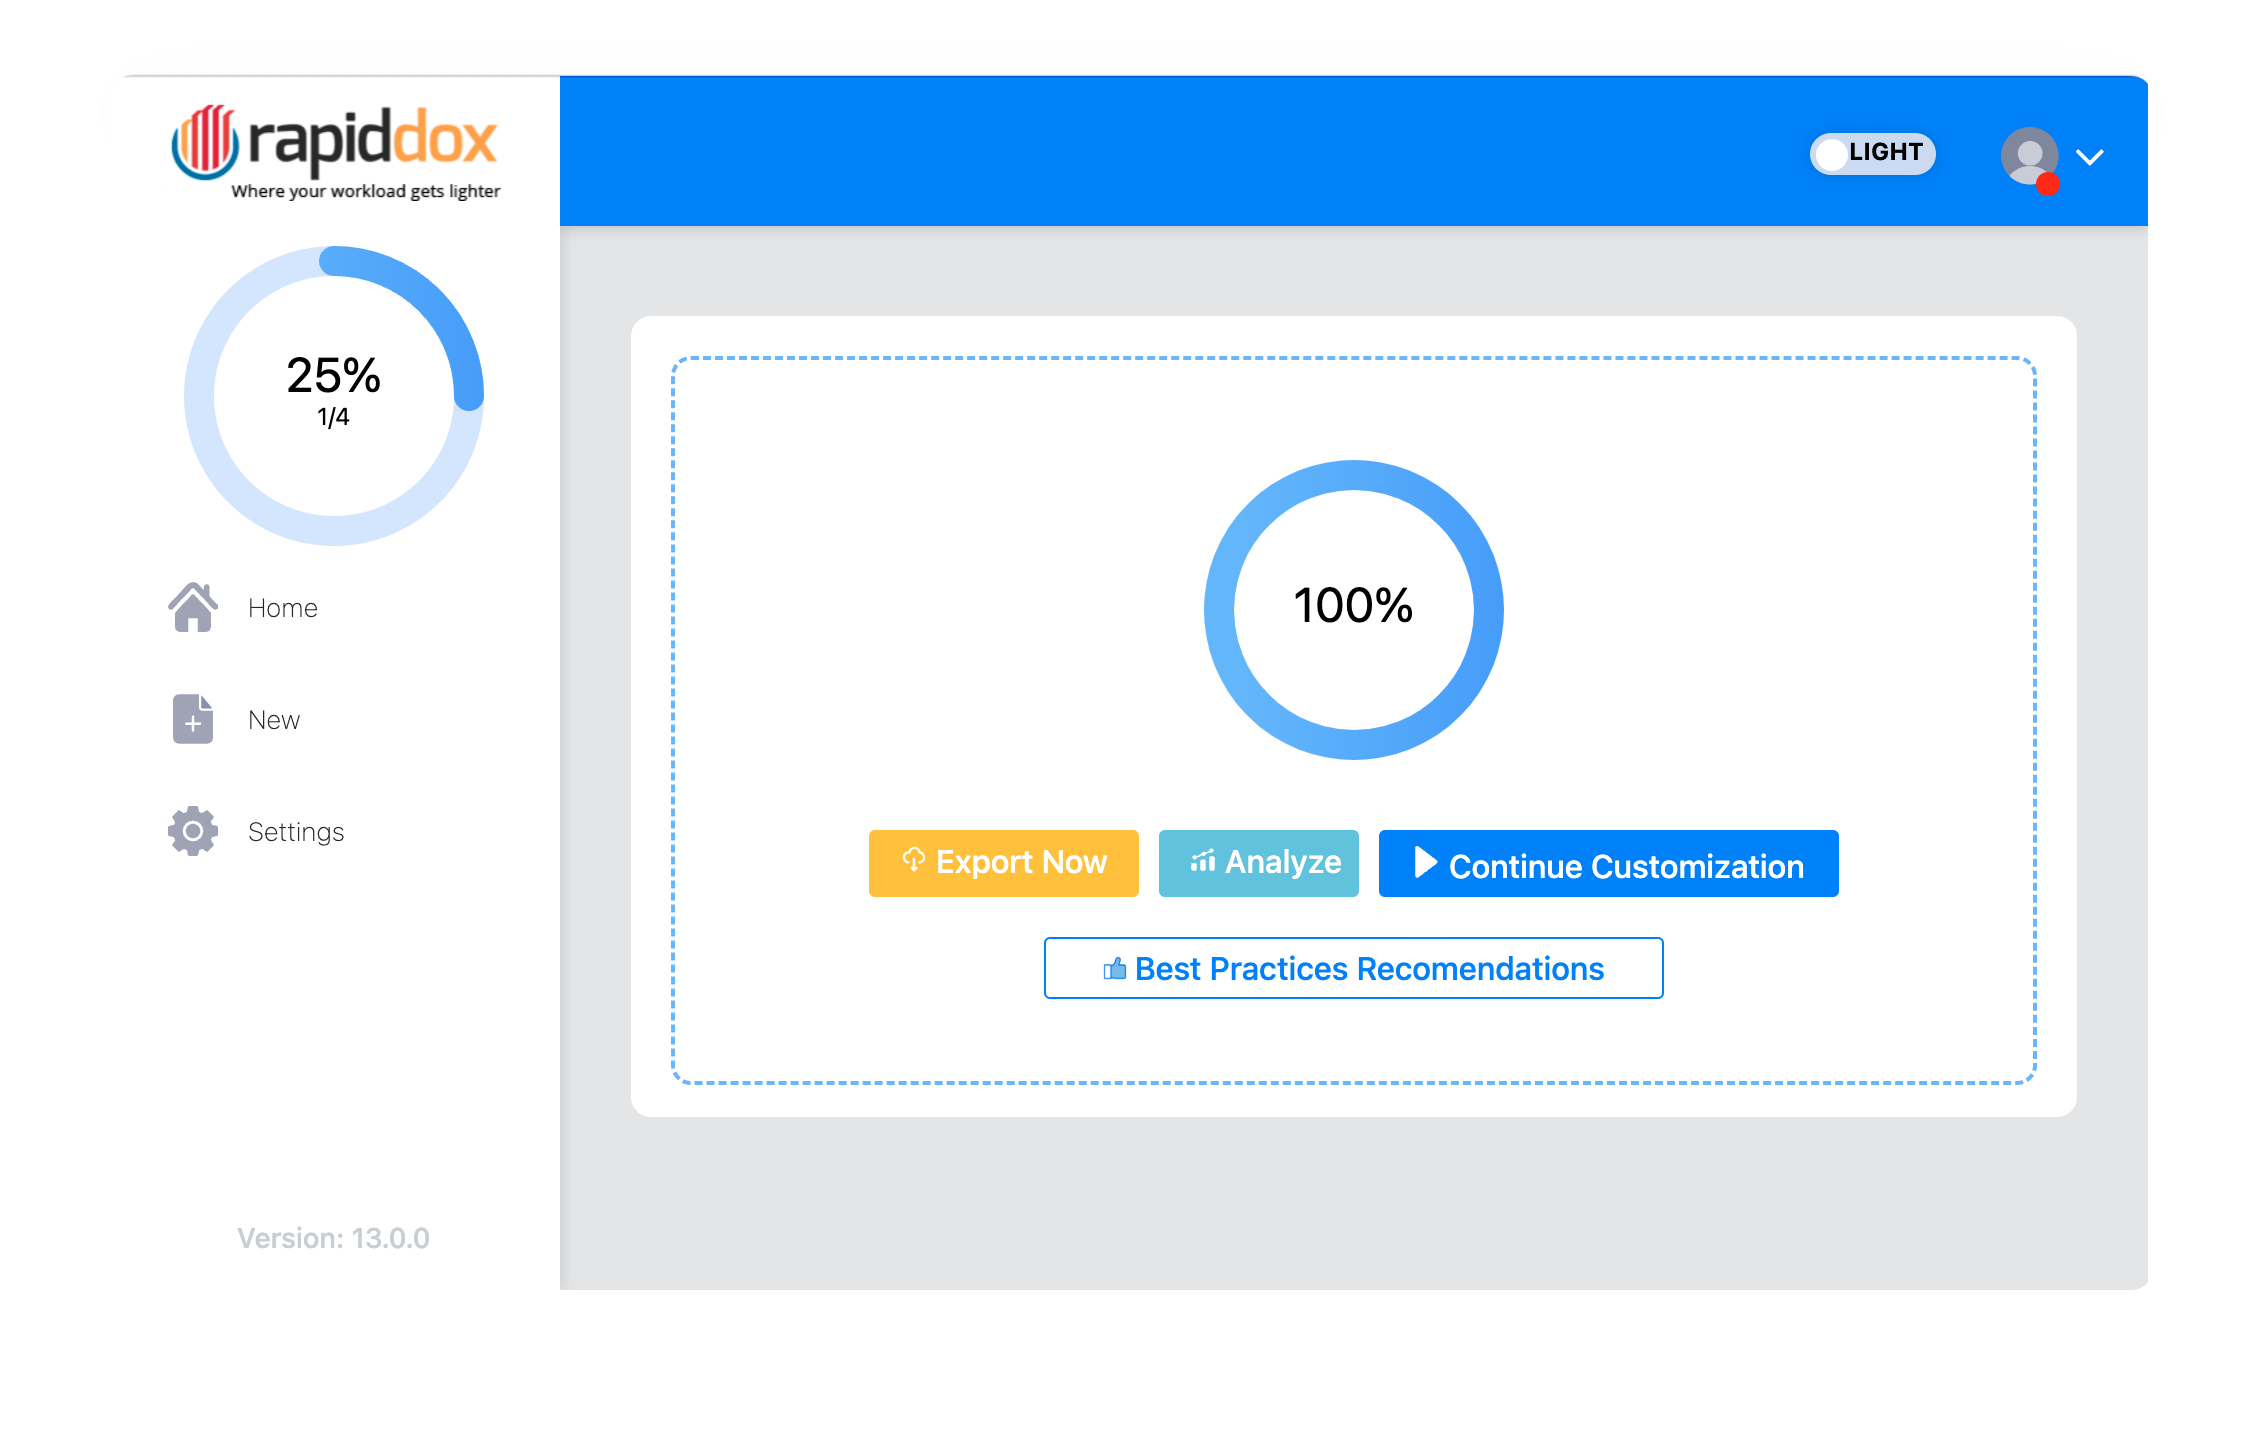
On the results screen, below Export Now, Analyze, and Continue Customization, RapidDox shows a Best Practices Recommendations button. Click it and RapidDox produces a PDF that reviews your file against Tableau performance best practices and lists, for each opportunity it finds, the specific objects involved and what to change.
.twb .twbx .tds .tdsx). It is not available for Tableau Prep or Power BI files currently. Some checks only apply to workbooks — a data source (.tds .tdsx) has no dashboards or worksheets, so those sections are simply left out (see Workbooks vs. data sources).Generating the report
After a Tableau file finishes processing, click Best Practices Recommendations on the results screen. RapidDox generates the report as a standalone PDF — it does not change your workbook or your main documentation export, and it reuses the header/footer text from your customisation settings.
What the report checks
| Section | Appears when… | What it tells you |
|---|---|---|
| Summary Stats | Always. | Counts of the main objects in the file — data sources, data source filters, custom SQL, fields, calculated fields, groups, hierarchies, parameters, sets, bins, and stories. |
| Live vs Data Extract | Any data source uses a live connection. | Lists the live data sources. Suggests extracting data into Tableau and limiting the dataset with data source filters or a slimmed-down view. |
| Unused Objects | Any unused worksheets, fields, calculated fields, parameters, hierarchies, sets, groups, bins, or data sources are found. | Lists the redundant objects and suggests removing them to speed up rendering and extract/Custom SQL refresh. |
| Multiple Worksheets on a Dashboard | A dashboard uses more than 4 worksheets. | Lists those dashboards and their worksheets. Suggests reducing the count — consolidating or aggregating into a single view where feasible. |
| Filtering | A dashboard filter uses “Only relevant values.” | Lists the affected dashboards/filters. Recommends avoiding “Only relevant values” (it relies on sequential queries) and using dashboard filter actions instead. |
| Custom SQL | Custom SQL is used on a live data source connection. | Lists those queries. Suggests connecting directly to a view in the source database rather than running Custom SQL. |
| Calculated Fields | The file has more than 10 calculated fields. | Lists the calculated fields so you can review them — each calculation consumes memory and can affect performance. |
| Dashboard Layout | A dashboard is not set to a fixed size (automatic sizing). | Lists those dashboards. Fixed-size dashboards render faster than automatically-sized ones. |
| General Guidance | Always. | A short list of general performance tips. |
Workbooks vs. data sources
A Tableau data source (.tds / .tdsx) contains no dashboards or worksheets, so the dashboard-based checks never apply — Multiple Worksheets on a Dashboard, Filtering, Dashboard Layout, and the unused-worksheet part of Unused Objects are left out. The data-source-level checks still run: Live vs Data Extract, Custom SQL, Calculated Fields, and unused fields/objects — along with the always-on Summary Stats and General Guidance.
Related
- Analyse — explore the generated documentation on screen.
- Workbook Metadata — what RapidDox extracts from a Tableau file.
- Output & Customisation — export and branding options.
- Desktop App Guide — install, sign in, and generate documentation.