When you click Export to Excel in the Impact Analysis section, Rapid BI Catalog generates and downloads a timestamped .xlsx file named Impact_Analysis_<date>_<time>.xlsx. The file always opens with a Summary sheet, followed by one Impacted Objects sheet per BI tool present in your results.
Sheets in the file
Which sheets you get depends on what your results contain. A search that reaches both estates produces three sheets; a search that reaches one produces two.
| Results contain | Sheets, in order |
|---|---|
| Tableau and Power BI content | Summary, Impacted Objects - Tableau, Impacted Objects - Power BI |
| Tableau content only | Summary, Impacted Objects - Tableau |
| Power BI content only | Summary, Impacted Objects - Power BI |
Summary sheet
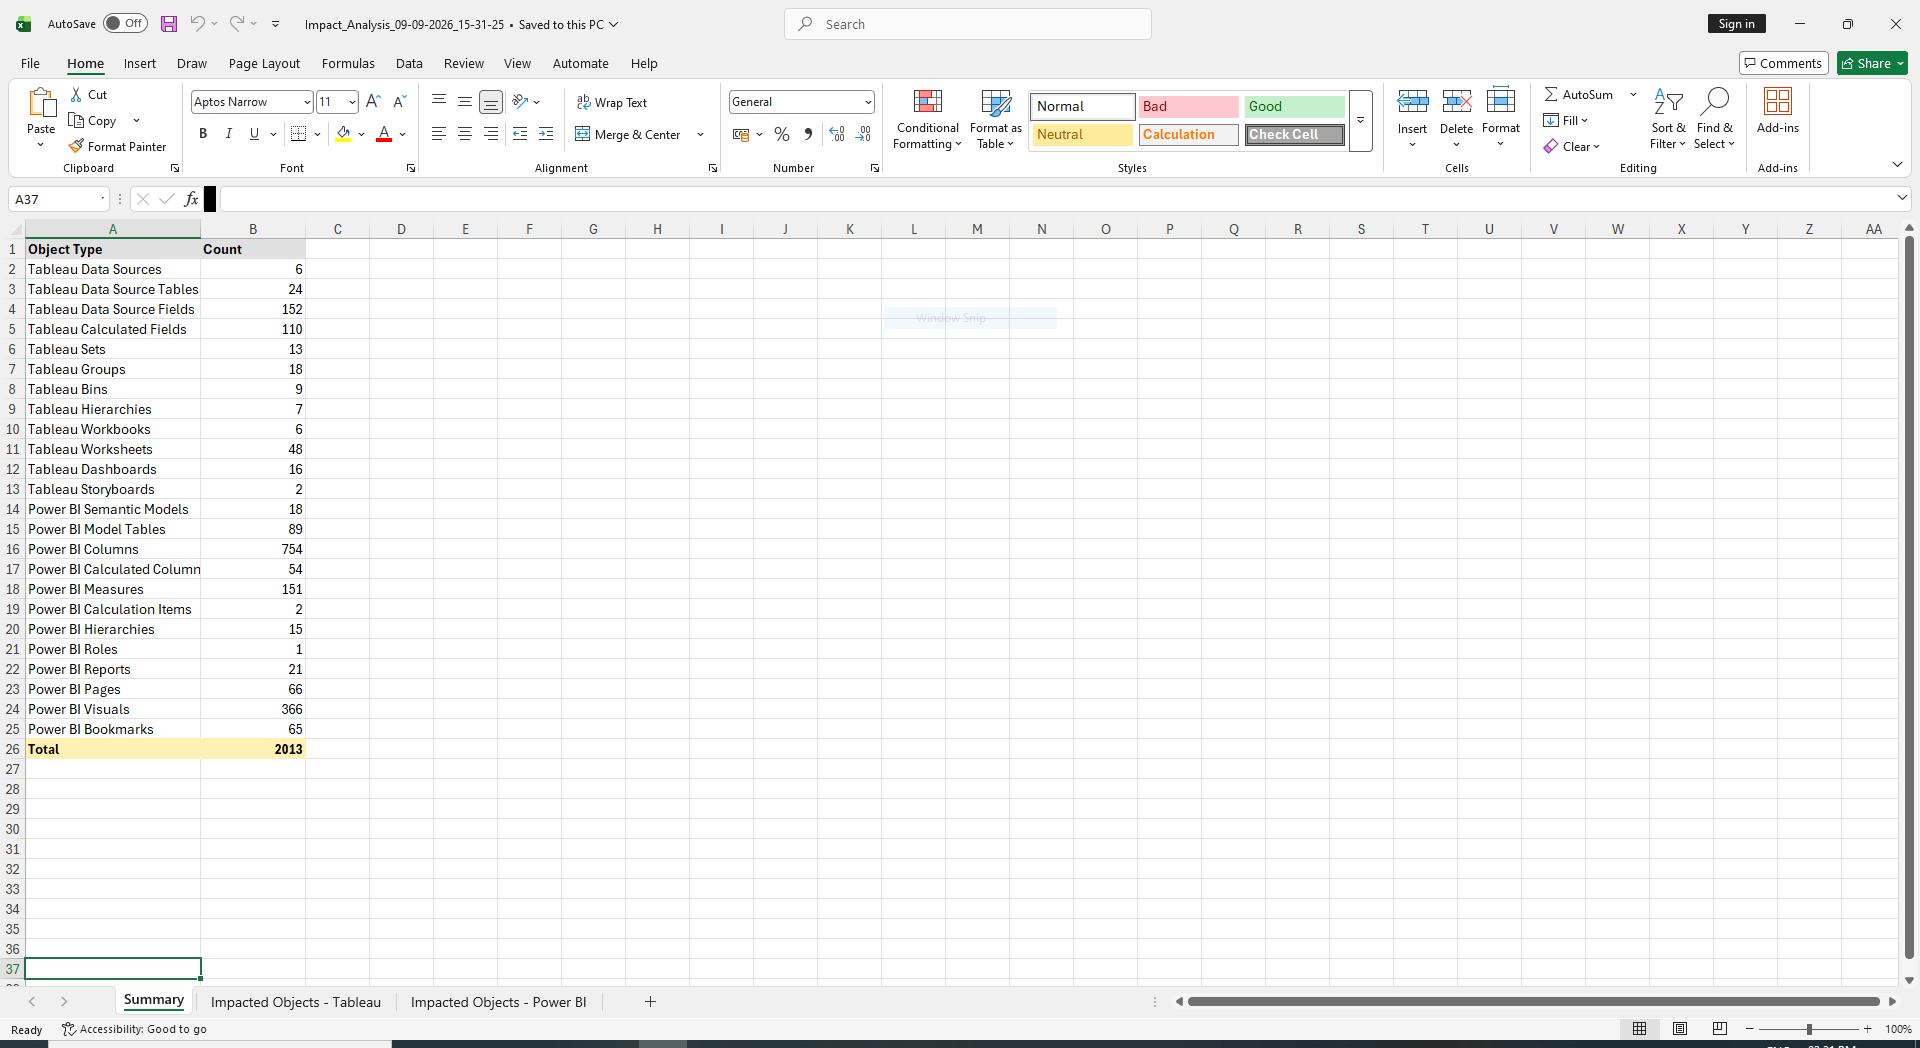
The Summary sheet counts every impacted object type in your selection. Every row names its estate, so a mixed export never leaves you guessing which tool a count belongs to.
| Column | Description |
|---|---|
| Object Type | The category of impacted object, prefixed with the tool it belongs to |
| Count | Number of distinct objects of that type impacted |
Row order
Rows appear in a fixed order. The Tableau rows appear only when the results contain Tableau content, the Power BI rows only when they contain Power BI content, and Total is always last.
| Tableau rows | Power BI rows |
|---|---|
| Tableau Data Sources | Power BI Semantic Models |
| Tableau Data Source Tables | Power BI Model Tables |
| Tableau Data Source Fields | Power BI Columns |
| Tableau Calculated Fields | Power BI Calculated Columns |
| Tableau Sets | Power BI Measures |
| Tableau Groups | Power BI Calculation Items |
| Tableau Bins | Power BI Hierarchies |
| Tableau Hierarchies | Power BI Roles |
| Tableau Workbooks | Power BI Reports |
| Tableau Worksheets | Power BI Pages |
| Tableau Dashboards | Power BI Visuals |
| Tableau Storyboards | Power BI Bookmarks |
| Total | |
Impacted Objects sheets
An Impacted Objects sheet gives the full detail — one row per impacted object per dependency path. A single object (for example, a Worksheet that uses fields from two different Tableau Data Sources) may appear on multiple rows, each representing a distinct path through the dependency graph.
Both sheets share the same first six columns — the source asset you searched for and its warehouse hierarchy — and the same last five: the impacted object, whether it is used, its type, and what it was built from. They differ in the middle, where each tool names its own containers.
Impacted Objects - Tableau
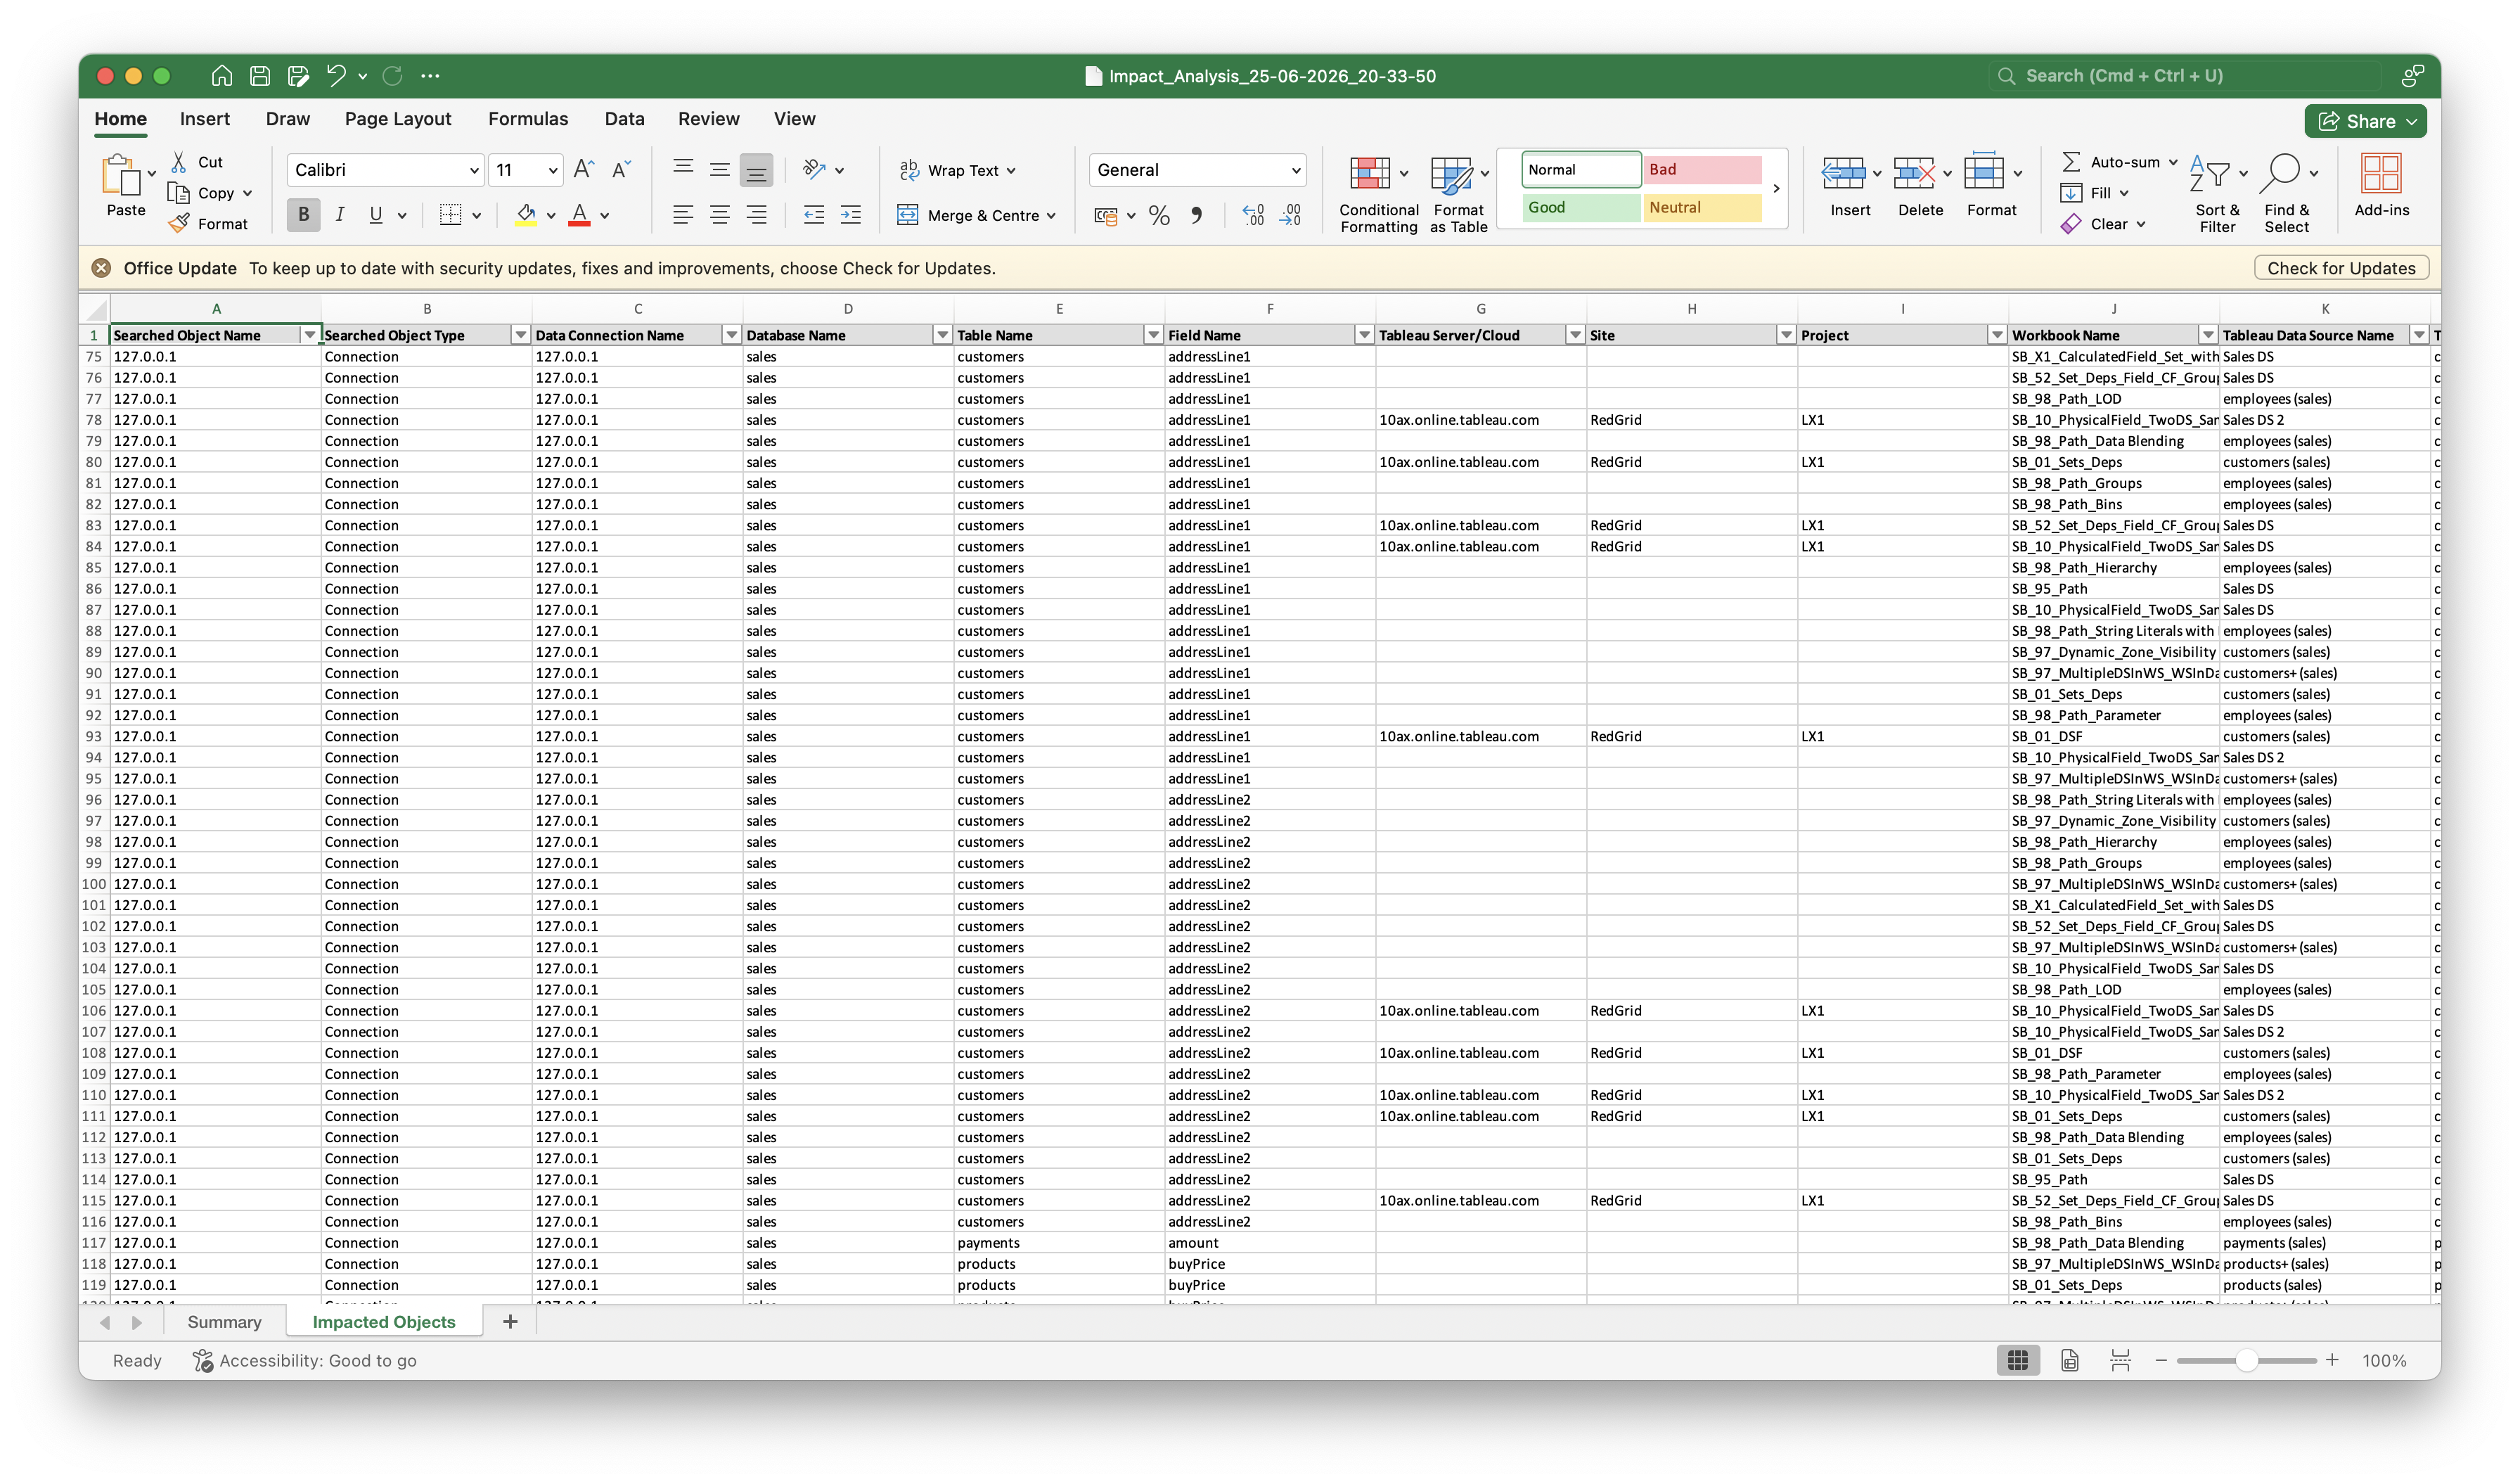
| # | Column Name | Description |
|---|---|---|
| 1 | Searched Object Name | The name of the data asset you searched for, at the level you selected in the filters |
| 2 | Searched Object Type | The type of the searched asset: Connection, Database, Table, or Field |
| 3 | Data Connection Name | The source data connection that contains the searched asset |
| 4 | Database Name | The source database within that connection |
| 5 | Table Name | The source table within that database |
| 6 | Field Name | The specific source field (populated only when filters were set to Field level) |
| 7 | Tableau Server/Cloud | The Tableau Server or Tableau Cloud connection the workbook belongs to |
| 8 | Site | The Tableau site that contains the workbook |
| 9 | Project | The Tableau project that contains the workbook |
| 10 | Workbook Name | The Tableau Workbook containing the impacted object |
| 11 | Tableau Data Source Name | The Tableau Data Source (inside the workbook) through which the dependency flows |
| 12 | Tableau Data Source Table Name | The table inside the Tableau Data Source |
| 13 | Impacted Object Name | The name of the specific impacted object |
| 14 | Is Used | Whether the object is used: Yes, No, or NA when no usage flag was recorded |
| 15 | Impacted Object Type | The type of the impacted object (see below) |
| 16 | Built From Object Name | The immediate upstream object that this impacted object depends on |
| 17 | Built From Object Type | The type of that upstream object |
Impacted Objects - Power BI
The Power BI sheet carries the searched object and its source hierarchy, then the report, workspace and semantic model the impacted object belongs to, then the object itself and what it was built from.
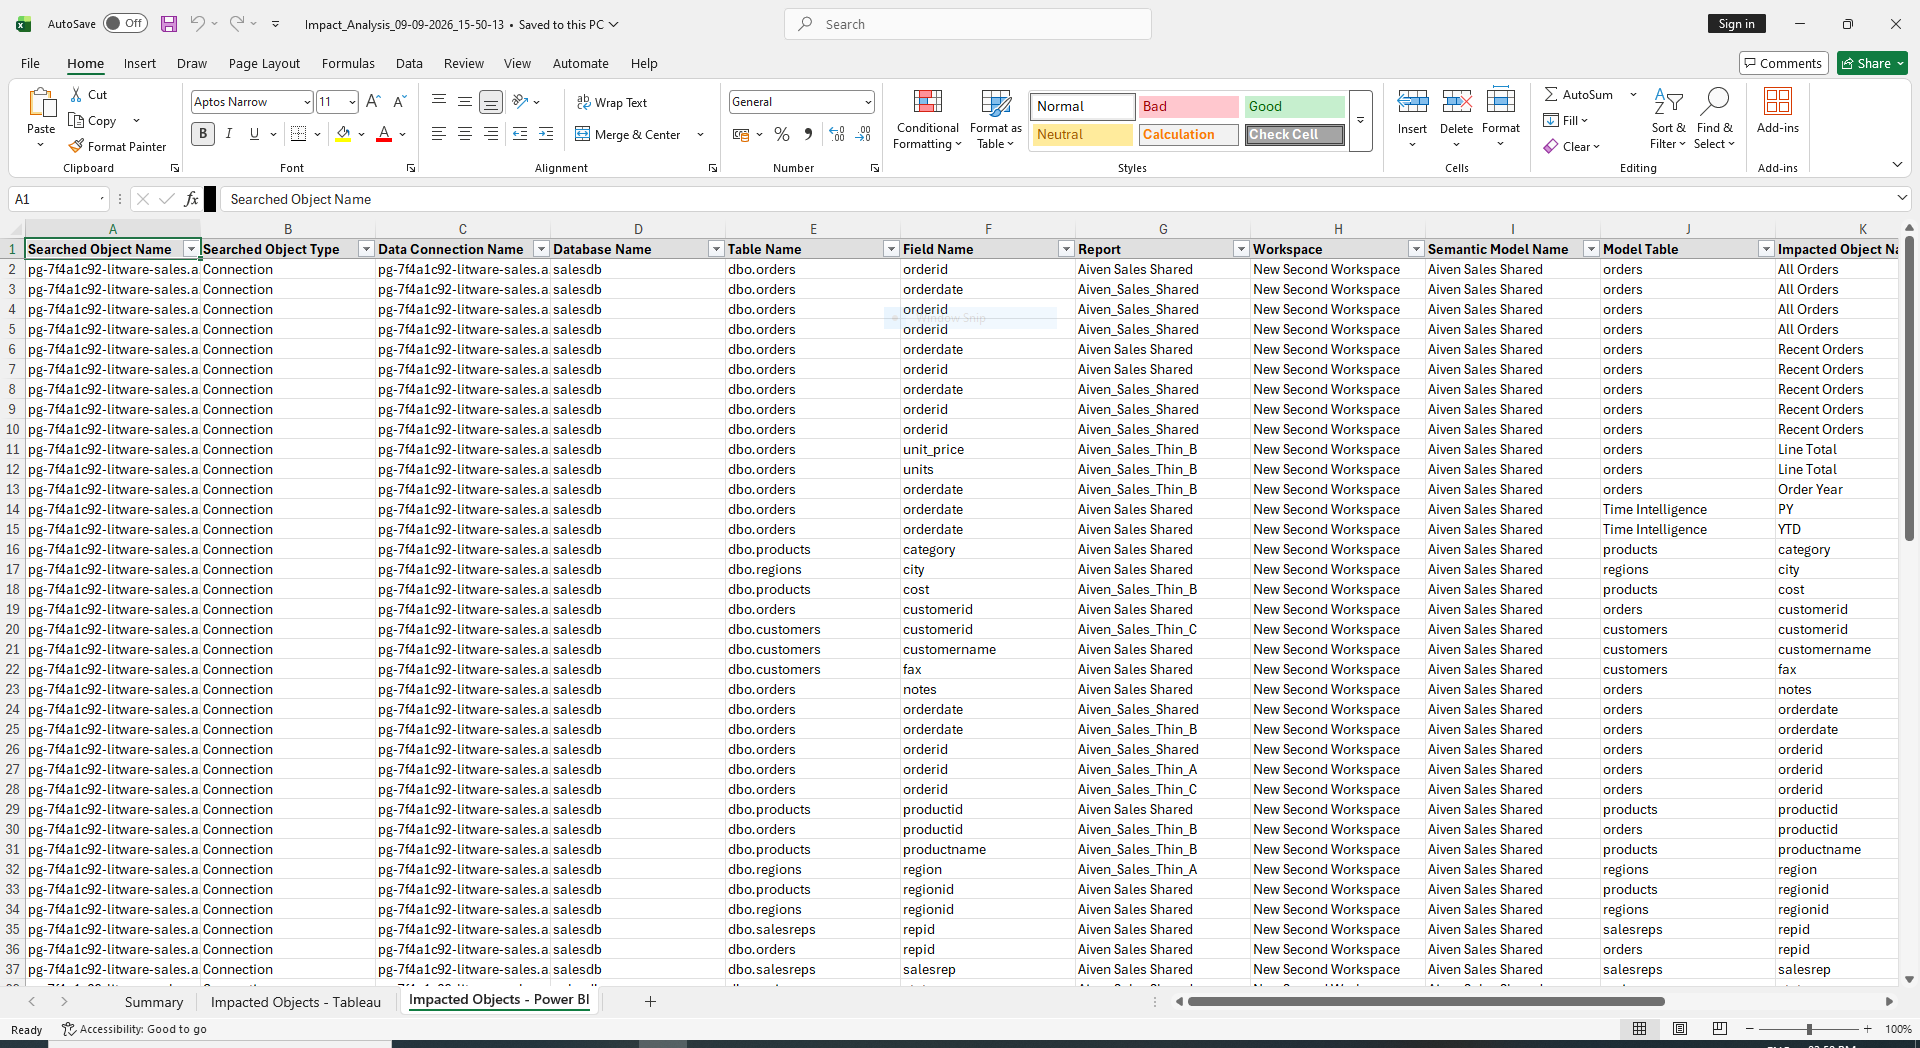
| # | Column Name | Description |
|---|---|---|
| 1 | Searched Object Name | The name of the data asset you searched for, at the level you selected in the filters |
| 2 | Searched Object Type | The type of the searched asset: Connection, Database, Table, or Field |
| 3 | Data Connection Name | The source data connection that contains the searched asset |
| 4 | Database Name | The source database within that connection |
| 5 | Table Name | The source table within that database |
| 6 | Field Name | The specific source field (populated only when filters were set to Field level) |
| 7 | Report | The Power BI Report containing the impacted object |
| 8 | Tenant | The Power BI environment the report belongs to (shown only when more than one is configured) |
| 9 | Workspace | The Power BI workspace that contains the report |
| 10 | Semantic Model Name | The semantic model through which the dependency flows |
| 11 | Model Table | The table inside the semantic model |
| 12 | Impacted Object Name | The name of the specific impacted object |
| 13 | Is Used | Whether the object is used: Yes, No, or NA when no usage flag was recorded |
| 14 | Impacted Object Type | The type of the impacted object (see below) |
| 15 | Built From Object Name | The immediate upstream object that this impacted object depends on |
| 16 | Built From Object Type | The type of that upstream object |
Possible values for Impacted Object Type
Each sheet uses its own vocabulary.
| Impacted Objects - Tableau | Impacted Objects - Power BI |
|---|---|
| Field | Column |
| Calculated Field | Calculated Column |
| Set | Measure |
| Group | Calculation Item |
| Bin | Hierarchy |
| Hierarchy | Role |
| Worksheet | Page |
| Dashboard | Visual |
| Storyboard | Bookmark |
Header row behaviour
- The header row is frozen — it remains visible as you scroll down through large result sets.
- Auto-filter dropdowns are enabled on every column, allowing you to filter and sort directly within Excel.
Understanding the Built From columns
The Built From Object Name and Built From Object Type identify the immediate upstream dependency — the object that the impacted object is directly derived from or depends on. They are the last two columns of both sheets.
| Impacted object | Built From example |
|---|---|
| Calculated Field | The field it references |
| Set | The Field that defines set membership |
| Hierarchy | One member field per row (a 3-member hierarchy generates 3 rows) |
| Worksheet | The upstream field or Calculated Field used in the view |
Row sorting
Rows in an Impacted Objects sheet are sorted in the following priority order (all alphabetical, case-insensitive):
- Searched Object Name
- Impacted Object Type
- Impacted Object Name
- Built From Object Type
- Built From Object Name
Starter plan (file-level) — reduced column set
On the Starter plan (file-level granularity), the Impacted Objects sheet is simplified — object-level columns require the Professional or Enterprise plan. The following columns are not shown:
- Impacted Object Name
- Is Used
- Impacted Object Type
- Built From Object Name
- Built From Object Type
- On a Tableau sheet, Tableau Data Source Name and Tableau Data Source Table Name
- On a Power BI sheet, Semantic Model Name and Model Table
What remains is the searched object, its source hierarchy, and the file the dependency reaches:
| Sheet | Columns shown |
|---|---|
| Impacted Objects - Tableau | Searched Object Name and Type, Data Connection Name, Database Name, Table Name, Field Name, Tableau Server/Cloud, Site, Project, Workbook Name |
| Impacted Objects - Power BI | Searched Object Name and Type, Data Connection Name, Database Name, Table Name, Field Name, Report, Tenant, Workspace |
Next Steps
- Explore dependencies visually: Lineage & Impact Analysis
- Connect a Power BI tenant: Power BI Service